
Financial Analysis · Hospitality The numbers behind the concept, before you sign the lease
We model a single location or a multi-unit rollout from your real menu, labor, and occupancy costs, so you see prime cost, four-wall margin, and breakeven before the buildout, not after. Every figure ties to an assumption you can adjust as the concept takes shape.
The Outcome
What a real financial model gives you
Not a spreadsheet of wishful numbers — a model built from your real drivers that a lender or investor can actually trust.
Four-wall economics you can trust
A clear view of what a single location earns after food, labor, and occupancy, so you know whether the unit itself makes money.
Breakeven in real terms
The covers, average check, and weekly sales a location must hit to cover its costs, so the target is a number, not a hope.
Honest expansion math
A unit-expansion model that shows what a rollout requires in capital and time, and where the plan is fragile, before you commit to it.
How we work
Here’s how we’d model it — from your drivers, not our wishes
We won’t hand you a hockey-stick built on invented assumptions. What follows is exactly how we’d model your business — from your real drivers, with transparent, stress-tested assumptions, and honesty about what can’t be known before you have the data. Where a number genuinely can’t be forecast yet, we build a framework to fill, not a fiction to sell.
Who it’s for: Operators opening a first location, restaurateurs planning additional units, and hospitality founders raising money or approaching an SBA lender who need numbers that hold up.
What We Model
What we model for restaurants & hospitality
Four workstreams that turn a concept and a lease into a model you can plan and finance around. Built from your real menu, labor, and occupancy costs, with every assumption on the table.
Prime cost
Is the menu economics viable?
The question: Food and labor together, your prime cost, make or break a restaurant, but they are buried in POS reports and payroll and never modeled cleanly.
What we’d build: A prime-cost model from your menu mix, recipe costs, and staffing plan, showing food cost %, labor cost %, and combined prime cost against the thresholds that keep a location healthy.
Four-wall
Does a single location make money?
The question: Corporate overhead and multi-unit noise hide whether an individual restaurant actually earns its keep.
What we’d build: A four-wall P&L for one location: sales down to food, labor, and occupancy, producing restaurant-level cash flow and margin before any overhead, so the unit stands or falls on its own.
Breakeven
What sales cover the costs?
The question: You need to know the covers and weekly sales a location must do to stop losing money, and how much cushion sits above that.
What we’d build: A breakeven model tying fixed and variable costs to average check and covers, yielding the daily and weekly sales threshold and the margin of safety above it.
Expansion
What does a rollout really take?
The question: Adding units sounds like multiplying success, but capital needs, ramp periods, and cannibalization make the real math far less clean.
What we’d build: A multi-unit model with per-unit buildout cost, a sales ramp curve, and staggered openings, rolling up to consolidated cash flow and the capital the expansion actually requires.
The Fuller Scope
The fuller scope
Beyond the core four, the engagement can extend into the specifics a buildout, a raise, or a rollout brings up.
Startup buildout & pre-opening budget
Construction, equipment, and pre-opening costs modeled into a total capital requirement, so you know what it takes to open the doors.
Menu engineering & pricing
Contribution margin by menu item and category, so pricing and menu-mix decisions rest on what each dish actually contributes.
Sales ramp & seasonality
A location's revenue modeled through its opening ramp and seasonal swings, rather than a flat monthly average that hides the cash gaps.
Labor scheduling & cost model
Labor built from a staffing model tied to service hours and covers, so the payroll line reflects how you actually schedule the floor.
SBA & lender loan package
A projection set and coverage view formatted for an SBA or bank submission, built from the same model your operating plan runs on.
Multi-unit consolidation & dashboard
Per-location results rolled into a portfolio dashboard with prime cost, four-wall margin, and sales trends across every unit.
Investor projections
A clean projection and return view for equity investors in a concept or rollout, driven by the same unit economics you operate on.
The Questions the Model Answers
The questions the model answers
A model earns its keep by answering the decisions that ride on the numbers. Here’s what ours is built to answer.
What is the prime cost?
Combined food and labor as a percent of sales, modeled from your menu and staffing, so you see the number that decides the location's health.
What are the four-wall economics?
A location-level P&L through occupancy that shows what the unit earns on its own, before overhead muddies the picture.
What sales hit breakeven?
The weekly and daily sales, in covers and check average, a location must clear to cover costs, plus the cushion above it.
How much capital to open?
A pre-opening and buildout budget that sums to the real cash needed to open one location, so the ask is grounded.
Does the rollout hold up?
A multi-unit build that shows the capital, ramp, and timing an expansion demands, and where the plan runs thin.
How thin is the margin?
Sensitivity on food cost, labor rate, and covers, so you see how little has to go wrong before the location stops making money.
Your model is built from the real numbers of the concept, menu and recipe costs, your staffing plan, the actual rent and terms of the space, so prime cost, margin, and breakeven all trace to inputs you can point to. For a location with no operating history, some drivers, covers, average check, ramp speed, are genuine unknowns, so we set them as explicit assumptions grounded in comparable concepts and stress-test them rather than presenting a single confident forecast. You get a framework you can tighten as real sales come in, not a projection dressed up as a promise.
The Engagement
Investor-grade, driver-based, and yours to run
A scoped modeling engagement built from the drivers you actually control — not a top-down guess. We map the assumptions, build the model, stress-test it with scenarios, and hand you a tool your team can run, present, and defend.
Transparent and honest. Every assumption is visible and sourced, downside cases are shown rather than hidden, and where something can’t be known yet we say so — a model you can stand behind, not one that flatters a deck.
Every business is different. Discovery is where we map the drivers your model runs on.
How It Works
From drivers to a model you can defend
-
Discovery & drivers
We map the real operating drivers — pricing, volume, cost structure, cash timing — and the decision the model has to support.
-
Model build
A clean, driver-based, three-statement or purpose-built model with a transparent assumptions tab everything flexes from.
-
Scenarios & sensitivity
Base, upside, and downside cases plus the sensitivities that show which assumptions actually move the outcome.
-
Review & pressure-test
We stress the model against the questions a lender or investor will ask — coverage, runway, returns, breakeven — and fix what doesn’t hold.
-
Deliver & support
You get a documented model your team can run, plus support taking it into the raise, the loan, or the board meeting it was built for.
FAQ
Restaurants & Hospitality — financial-modeling questions
What tools do you build in?
Excel or Google Sheets, unlocked and formula-driven, so you can open every cell and keep using the model long after we finish. Nothing is hidden in software you would have to pay to keep, and nothing you cannot maintain yourself.
Is this lender- and investor-grade?
Yes. The model is built to the standard an SBA lender, bank, or equity investor expects: transparent prime-cost and four-wall logic, breakeven, and a documented assumptions layer they can question directly.
How long does it take?
A single-location startup model is often about a week; a multi-unit rollout with staggered openings takes longer. The main driver is how settled your menu, staffing plan, and lease terms are when we begin.
What does it cost?
Scoped to the work. A one-location model costs less than a multi-unit rollout with a consolidation dashboard and lender package. We quote a flat fee against a clear scope before starting.
Do you use our real numbers?
Yes. We model your actual recipe costs, menu prices, staffing, and occupancy. For an unopened location we set the unknowns, covers and check average, as explicit assumptions from comparable concepts rather than a generic template.
We have not opened yet and have no sales, can you still model us?
Yes, and we are candid about the uncertainty. With no history we build covers, average check, and ramp from comparable concepts and your own cost structure, label them clearly, and design the model to absorb real POS data the day you open.
Simple projection or full model, which do we need?
For a single location, a four-wall model with breakeven is often enough. For a rollout or a raise you need the multi-unit build and consolidated view. We recommend the model that matches your decision, not the largest one.
Do you help with the lender or investor pitch?
We build the projection package and prepare you for the questions a lender or investor will ask about the numbers. We do not arrange the financing, but you will be able to walk through and defend every figure yourself.
Proven Work
Our work in Food & Beverage
Engagements from the same sector as Restaurants & Hospitality — each with the figures it published.
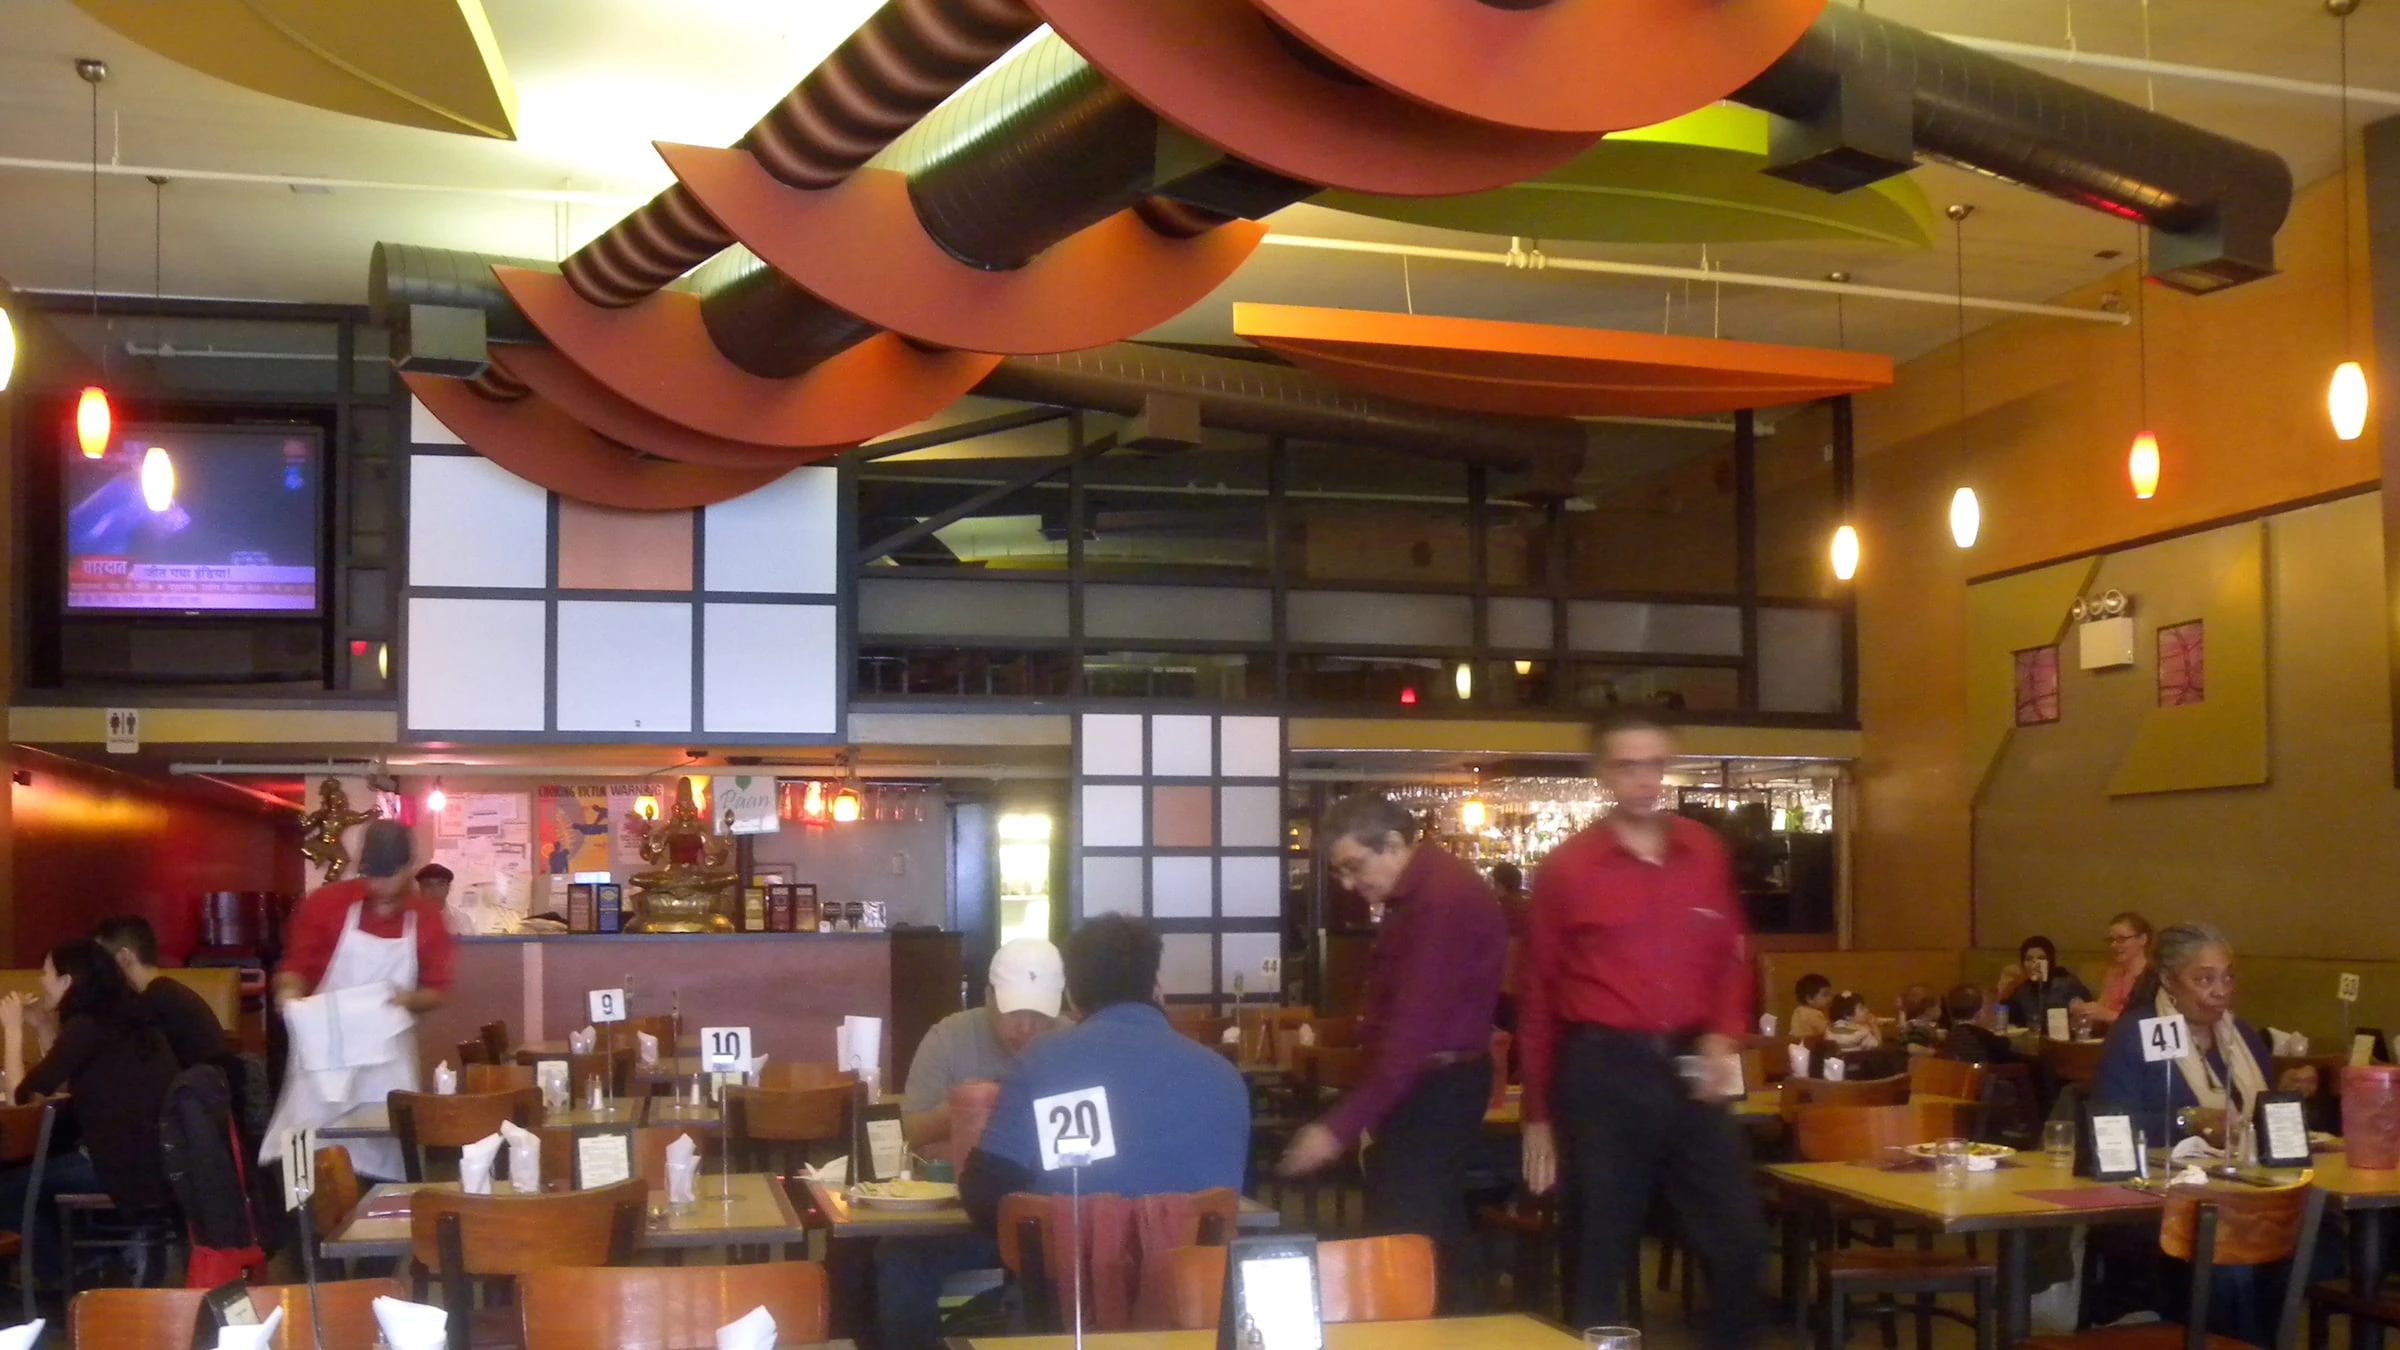
Food & Beverage · Restaurant
Sundara Indian Restaurant: From Caterer to Full-Service, With the Numbers to Fund It
$360K+real first-year catering revenue — proven demand, not a projection
A financing-ready plan and model to convert proven catering demand into a full-service restaurant
Read the engagement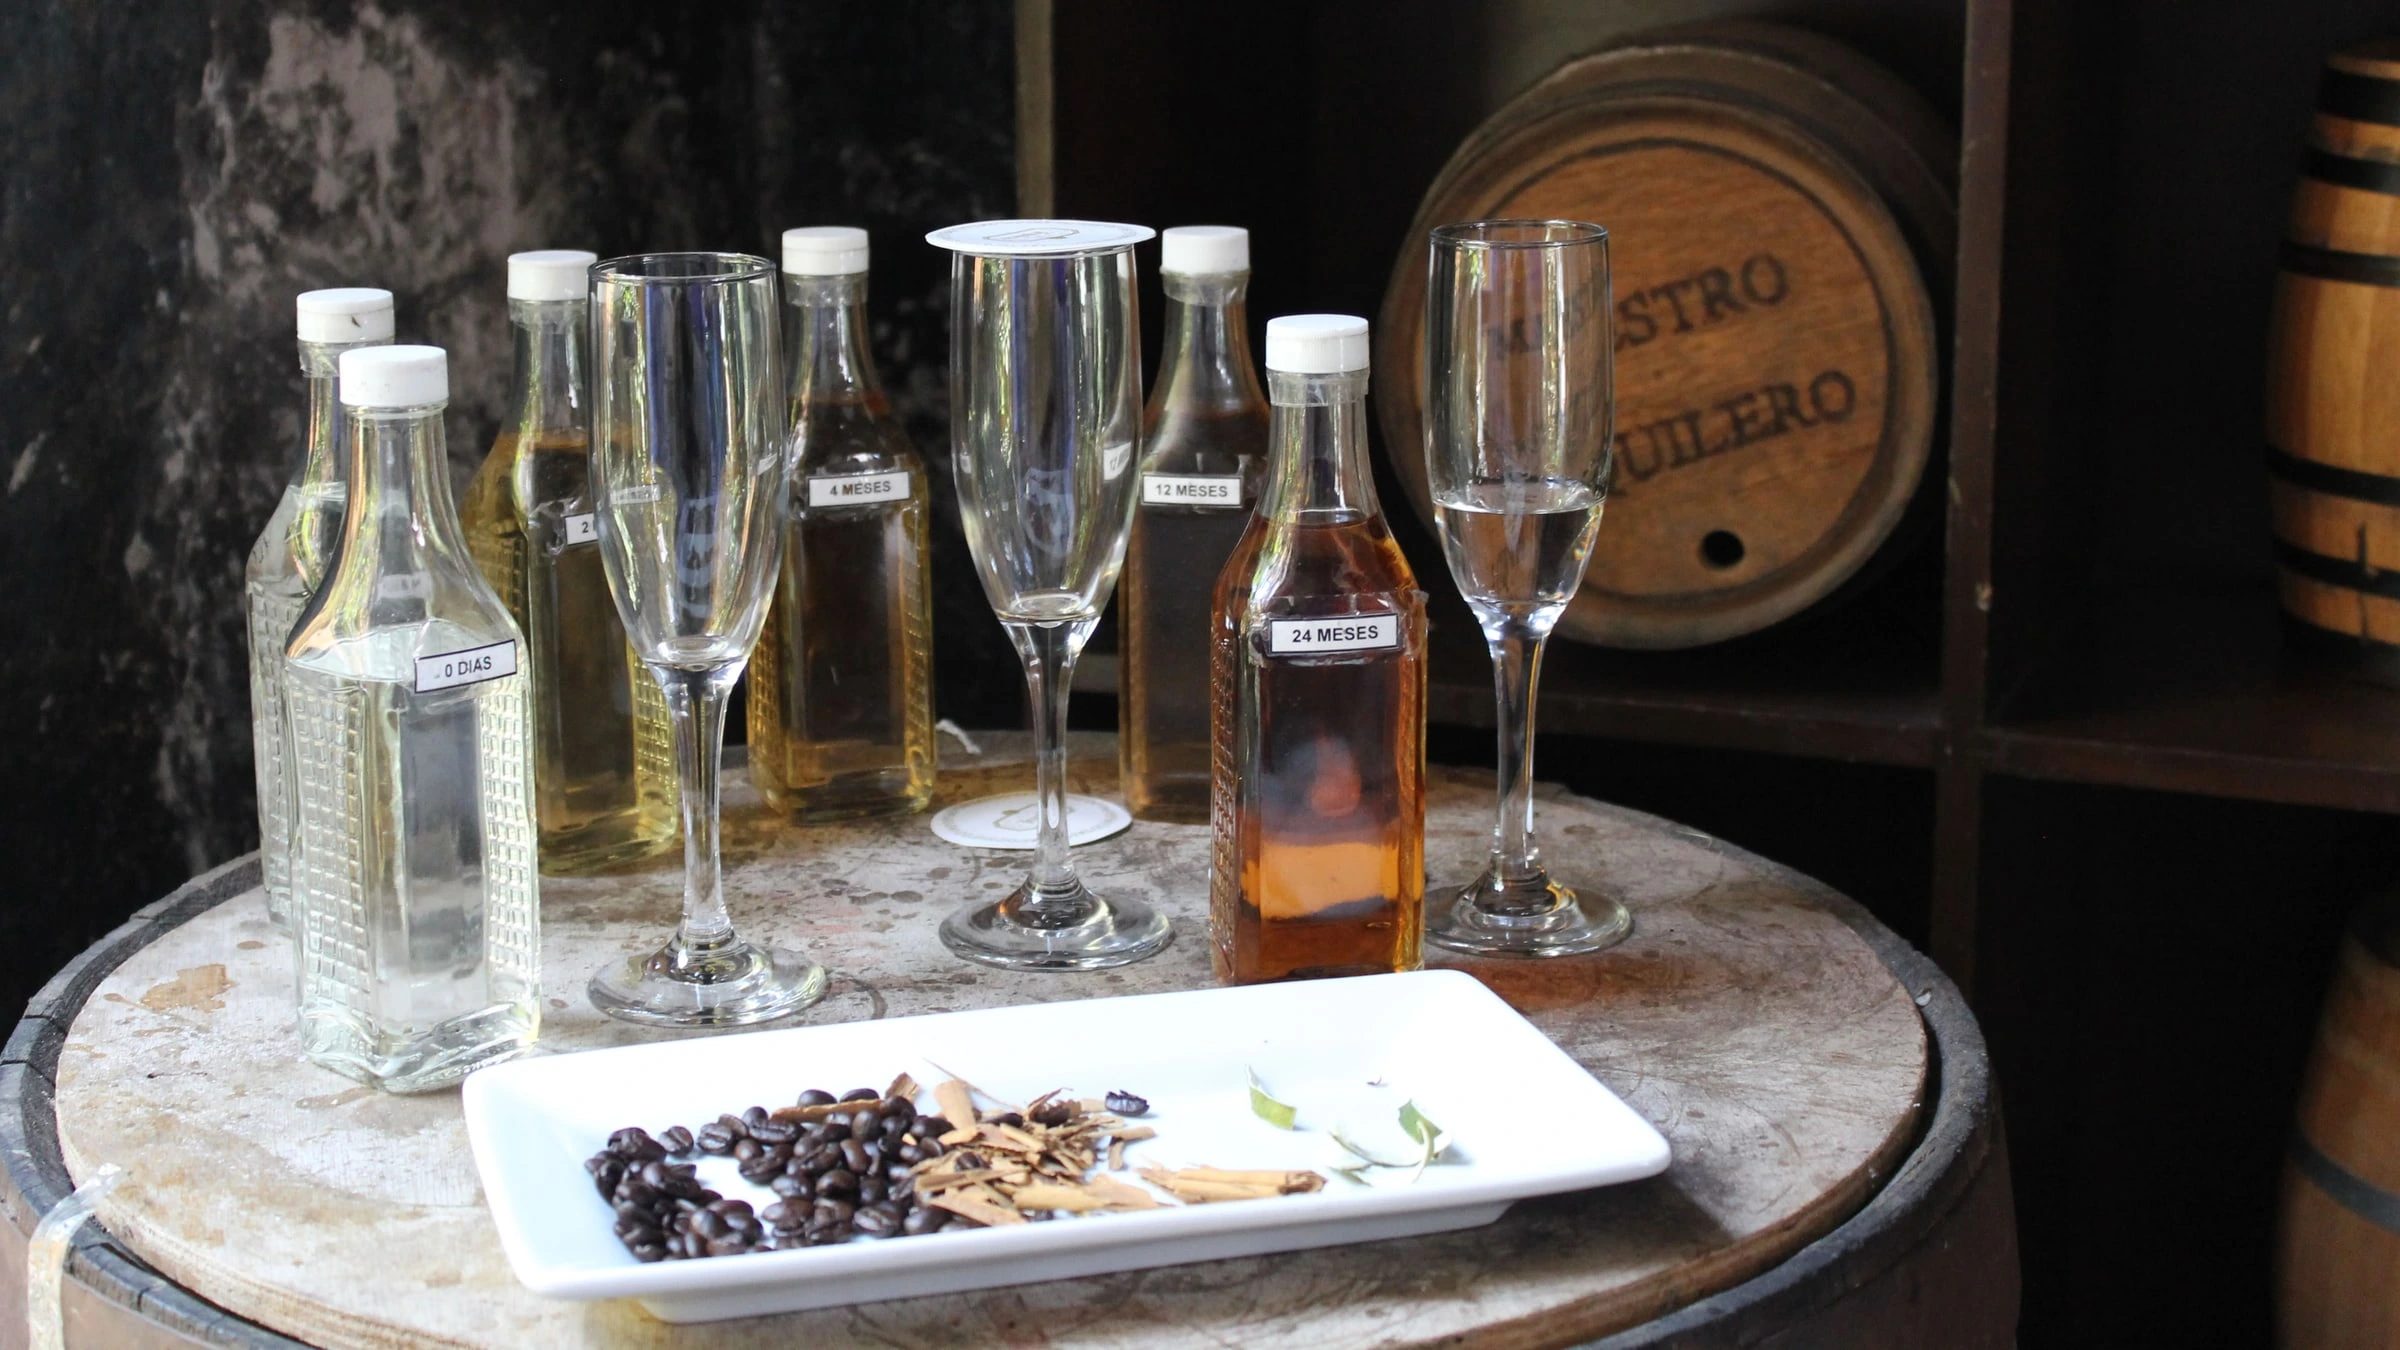
Beverage, Spirits & CPG
Snow Tequila: Rebuilding the Raise Around a Real Model
$1MFounders' Round SAFE, at a 25% discount to Series A
An investor-ready plan, dual-scenario model, and deck matching a standout product with standout documentation
Read the engagement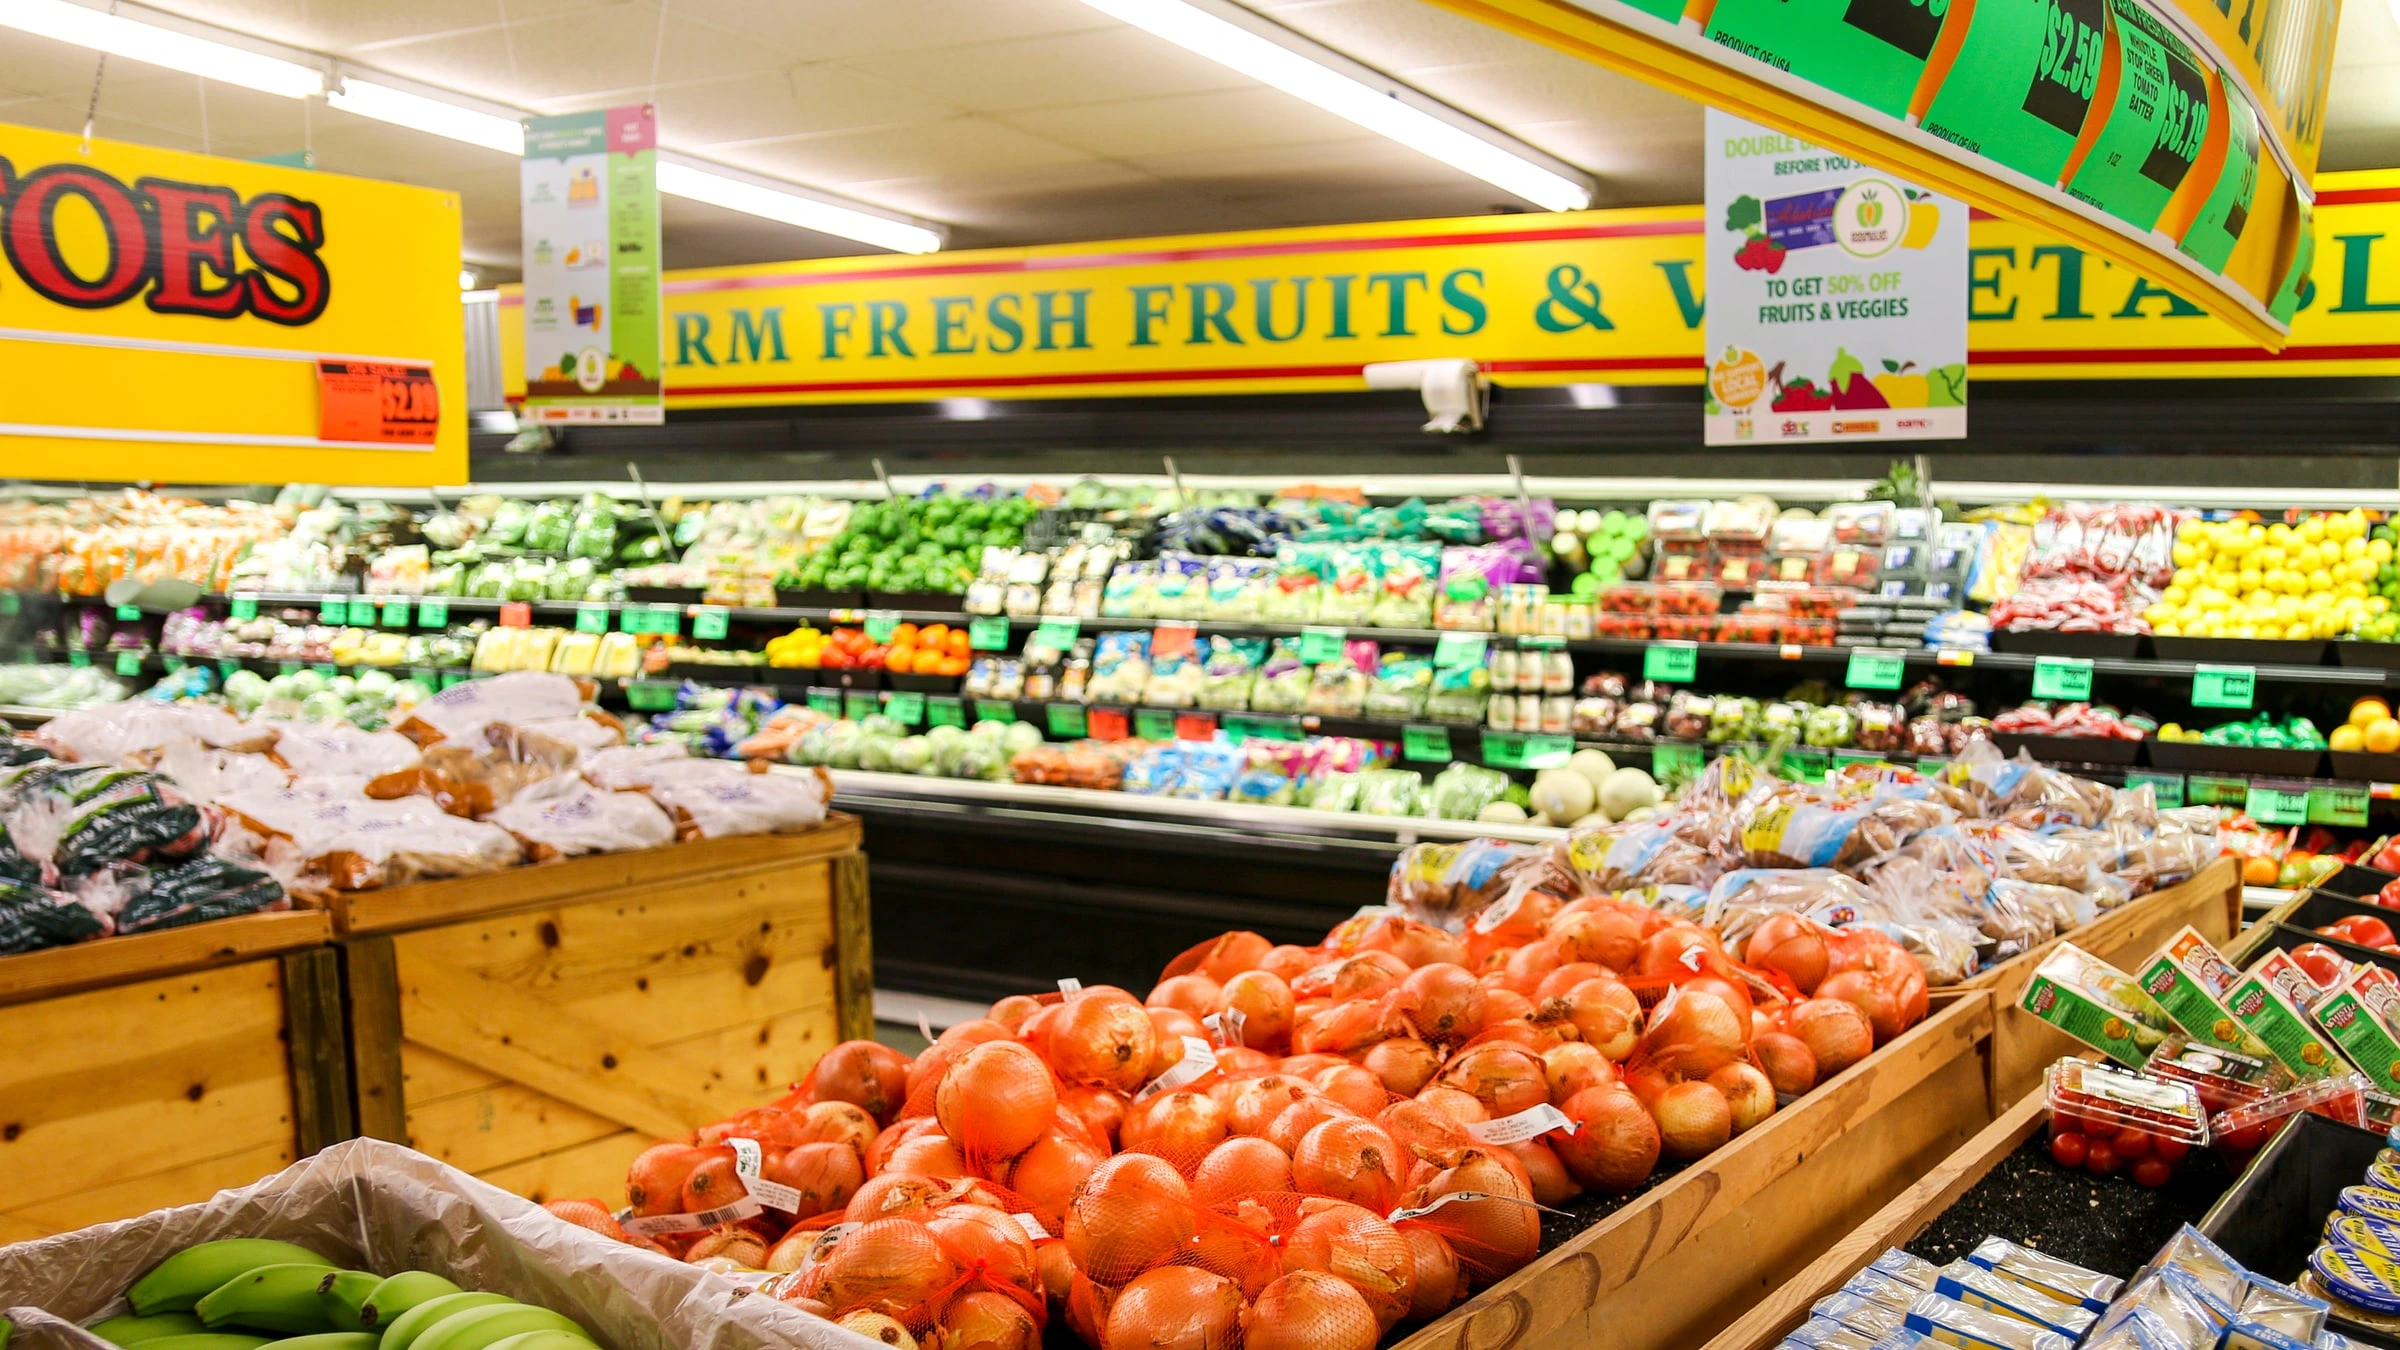
Specialty Retail & Grocery
Friendly Hypermarket: A Plan for a Community Grocery
Focuseda plan built around one clearly defined community
A financing-ready plan and model grounded in a clear market fit
Read the engagementRelated Pages
More for Restaurants & Hospitality, and beyond it
Other services for Food & Beverage
Financial Analysis for other industries
- Financial Analysis for E-commerce & DTC
- Financial Analysis for Construction & Contractors
- Financial Analysis for Healthcare Practices
- Financial Analysis for Manufacturing & Products
- Financial Analysis for Energy & Infrastructure
- Financial Analysis for Startups & Fundraising
- Financial Analysis for Real Estate
The Full Practice